Tankan Manufacturing Index is the highlight of this week. Here's an outlook for the Japanese events and an updated technical analysis for USD/JPY.
Japan's economy grew a revised 1.1 % in July-September from the previous quarter but that offered little comfort to policymakers worried by slowing growth in the current quarter. The October-December quarter is expected to show a slowdown. Will the BOJ intervene and ease policy further?
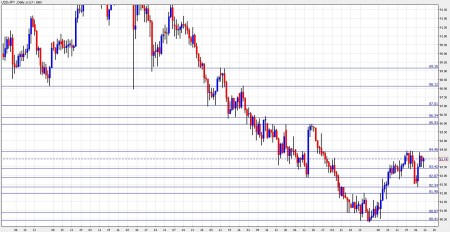
USD/JPY daily chart with support and resistance lines marked. Click to enlarge:
Let's start:
- Revised Industrial Production: Tuesday, 4:30. Japanese industrial production fell 1.6% in September, revised up from a preliminary 1.9% drop however this marks the fourth month of declines. The revised index includes also food, tobacco and medical sectors which helped reduce the drop. The decline is mainly due to lower demand for passenger cars, chassis and auto parts due to the termination of the government's subsidy for buying fuel-efficient vehicles in early September.
- Tankan Manufacturing Index: Tuesday, 23:50. The Tankan Large Manufacturing Index grew 7 points and reaching 8 in the September quarter against 7 points expected. The Tankan Non-Manufacturing Index also improved gaining 2 points in the third quarter better than -2 forecasted following -5 reading in Q2. However December quarter seems bleak due to declining demand at home and abroad, rises in raw materials and a strong Yen. The December tankan is expected to show the sentiment index for big manufacturers down 5 points. A decrease to 4 is expected now.
- Tertiary Industry Activity: Tuesday, 23:50. This index measuring tertiary industry activity on Japan declined 0.9 percent in September compared to the previous month, reaching at a seasonally adjusted 97.9. Expectations were for a lower 0.5% decrease. The decline was apparent in retail, communications, real estate and amusement services. An increase of 0.4% is expected now.
USD/JPY Technical Analysis
After dropping to 82.34 at the beginning of the week, USD/JPY climbed and settled above the 83.40 line (mentioned last week) before closing at 0.8394.
Dollar/Yen is now capped by 84.40, which proved to be a strong line in recent weeks. Higher, 85.93 is the highest level reached after the big intervention in September, and is strong resistance as well.
Above, the next lines are rather close – 86.35 was a support line in July and later switched to resistance. Right afterwards, 86.88, that worked as support earlier.
More important resistance is found at 88.10, which was a support line in March and later served as resistance. The last resistance line for now is 89.15 which capped the pair quite some time ago.
Looking down, 83.40 proved to be a significant line once again, and now provides immediate support. Below, 82.87, the lowest level before the intervention is the next line, although it became less important. The past week's low of 82.34 is another minor line on the way down.
Lower, the next line of support is 82, the round number that capped the pair during October and November. Below, 80.87 is a weaker line, after providing support at the beginning of October.
Below, 80.40 is the lowest close the pair ever had, and it's followed by the lowest intra-day low of all times 0.79.75.
I remain bullish on USD/JPY.
Higher yields on US treasuries continue to boost the pair, as well as fears of intervention, if dollar/yen dips too low.

No comments:
Post a Comment